Construction aggregate hauling statistics: the 2026 numbers behind every dump truck load
Steve Woods · Lead Dispatcher, TruckSprint
Steve Woods leads the TruckSprint dispatch desk and reviews every guide we publish. How we research and update guides.
Updated October 2026
Quick answer
Key takeaways (updated October 2026): the U.S. produced an estimated 1.5 billion metric tons of crushed stone and 870 million metric tons of construction sand and gravel in 2025 (USGS). Producer prices rose to about $18.50 and $14.50 a ton. It comes from about 10,000 quarries and pits in all 50 states and goes mostly into concrete, asphalt and road work.
Source: USGS, Mineral Commodity Summaries 2026: Stone (Crushed) · checked 2026-10
Every dump truck load starts in one of these numbers. I'm Steve, lead dispatcher at TruckSprint. Dump trucks are one of the eleven equipment types we dispatch, and aggregate is the freight that keeps most of them busy. This page collects the public statistics behind that work, with every number linked to its source and year. All USGS figures are 2025 estimates in metric tons.
Crushed stone
- 1.5 billion metric tons produced in 2025, unchanged from 2024.
- $27 billion in value.
- 1,400 companies operating 3,500 quarries and more than 180 sales or distribution yards in all 50 states.
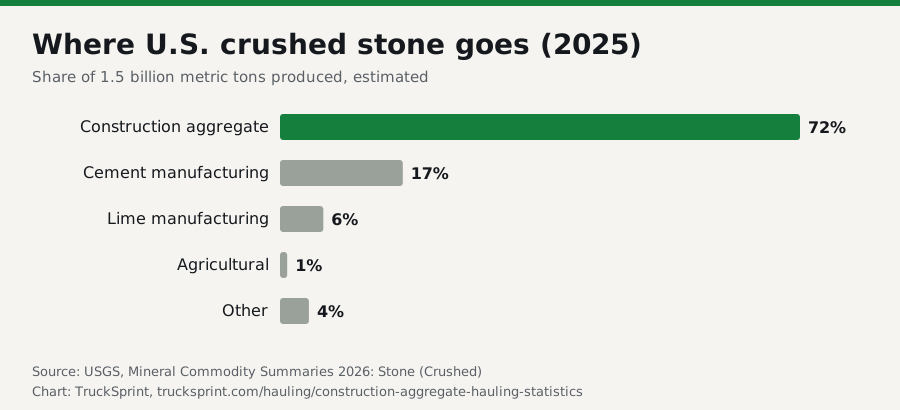
- 72% used as construction aggregate, mostly for road construction and maintenance; 17% for cement and 6% for lime.
- 70% was limestone and dolomite, and 14% granite.
- Top producing states: Texas, Pennsylvania, Florida, Missouri and Ohio; the top ten made about 56% of output.
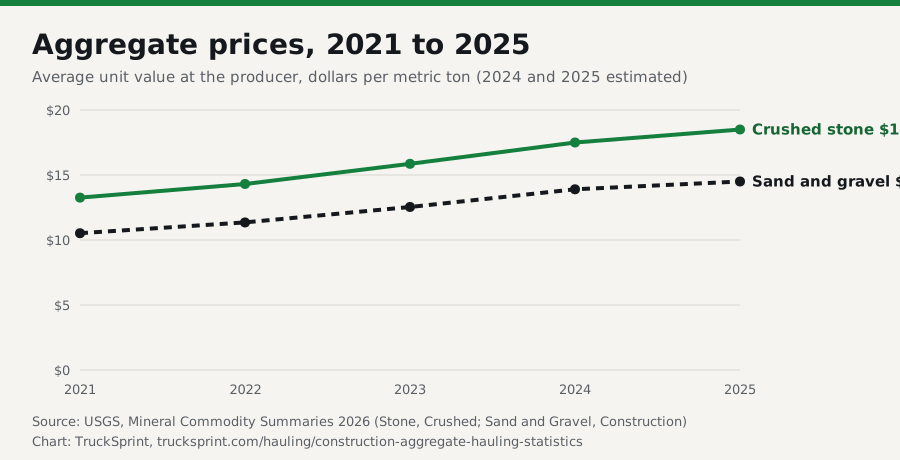
- $18.50 per metric ton average unit value at the producer, up from $13.26 in 2021.
- 71,200 people employed at quarries and mills.
Source: USGS, Mineral Commodity Summaries 2026: Stone (Crushed) · checked 2026-10
Embed this chart
Construction sand and gravel
- 870 million metric tons produced in 2025.
- $12.6 billion in value.
- 3,400 companies operating 6,500 pits and more than 200 sales or distribution yards.
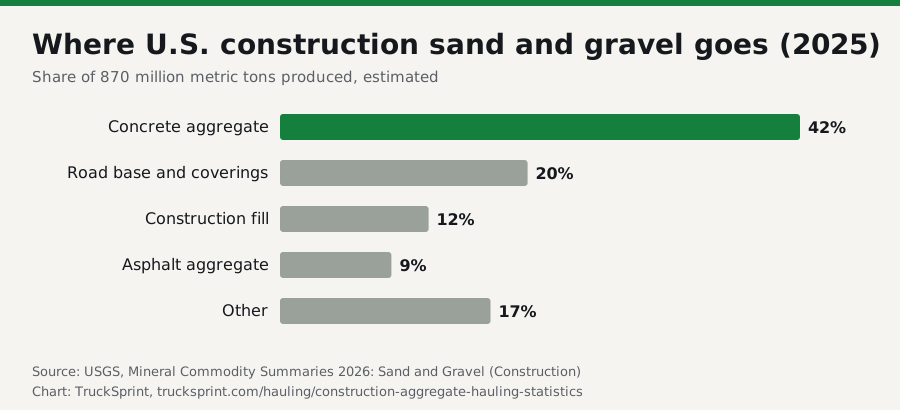
- 42% used as concrete aggregate, 20% for road base and coverings, 12% for construction fill and 9% for asphalt aggregate.
- Top producing states: Texas, California, Arizona, Minnesota and Michigan; the top ten made about 54%.
- $14.50 per metric ton average unit value, up from $10.52 in 2021.
- 41,900 people employed at pits and mills.
Source: USGS, Mineral Commodity Summaries 2026: Sand and Gravel (Construction) · checked 2026-10
Embed this chart
Prices
Producer prices for both rose every year from 2021 to 2025. USGS expected the factors behind higher crushed stone prices to continue into 2026, especially in and near metropolitan areas.
Embed this chart
These are average values at the producer across all uses, not delivered prices. The haul is on top, which is where dump trucks come in.
Construction spending
- $2,203.1 billion: total U.S. construction spending at a seasonally adjusted annual rate in August 2026.
- $547.8 billion: public construction spending, same month.
- $150.6 billion: highway construction, same month.
- 3.1% lower: construction spending in the first eight months of 2026 than in the same period of 2025 ($1,450.4 billion vs $1,496.6 billion).
Source: U.S. Census Bureau, Monthly Construction Spending, August 2026 (released Oct 1, 2026) · checked 2026-10
- $56.8 billion in federal-aid highway program funding authorized for fiscal year 2026 under the 2021 Infrastructure Investment and Jobs Act, with funding set to expire at the end of FY 2026, as reported by USGS. Check the current status of federal highway reauthorization.
The trucking workforce
- 2,062,040 heavy and tractor-trailer truck drivers employed (wage and salary jobs, May 2025), with an annual mean wage of $59,710 (BLS OEWS, SOC 53-3032). The category includes dump truck drivers but isn't specific to them, and excludes self-employed owner-operators. See truck driver pay by state.
Source: U.S. Bureau of Labor Statistics, Occupational Employment and Wage Statistics, May 2025, SOC 53-3032 · checked 2026-10
Where the material goes
- Sand1.45 t/yd³
- Gravel (1/4-2 in)1.42 t/yd³
- Loose aggregate1.4 t/yd³
- Base course1.25 t/yd³
- Topsoil0.8 t/yd³
What it means for a dump truck owner
- Demand follows construction and roads. Highway funding, public spending and new building drive aggregate volume. Watch the Census release and your state DOT's lettings.
- Production is spread out. About 10,000 quarries and pits operate across all 50 states, so the work is everywhere. Loop time and per-ton versus hourly pay decide what each haul earns; see hauling aggregate.
- Rising material prices make every ton on the truck more valuable to the customer, and a legal, full load more valuable to you; check your payload in dump truck capacity.
- Public work often carries prevailing wage rules for drivers; see prevailing wage hauling rates.
For what trucks cost per hour on public schedules, see dump truck hauling rates.